Keys to Understanding Vector Diagrams and Sign Convention Based on Angles
Firmware patch 1.1.0.8 brings a minor change to the way the PowerMaster looks at and displays power and phase angles, making it easier to understand vector diagrams. The change was based on a desire to be more standardized based off the latest version of the meterman’s handbook.
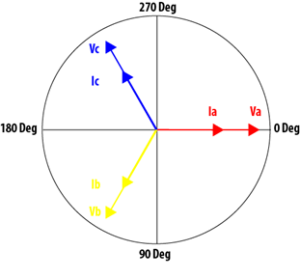
When looking at a typical phasor diagram on a meter, it is assumed the current phasors are rotating counter clockwise, with the voltage phasors stationary at their pre-determined locations. For demonstration purposes, Figure 1 is a 4 wire wye configured system, with ABC rotation. Phase A voltage, or Va, lays on the primary “x” axis at 0° phase shift. Ia is laying on top of the voltage phasor at 0° as well, indicating unity power factor, or a power factor of 1. Phase B and C voltages and current pairs are separated by 120 degrees.
When a phase shift between the voltage and current occurs, this is due to reactance on the load, typically in the form of inductance. This creates a lagging power factor. When something is referenced as leading or lagging, this is a means of relating the phase relationship of the current waveform to the voltage waveform, and is always with reference to what the current is doing. Remembering the following phrase, “ELI the ICE man” describes the following:
- E – Electromotive force, Voltage
- I – Current
- C – Capacitance
- L – Inductance
ELI represents that in an inductive circuit, the current is lagging the voltage. ICE gives the current leading the voltage in a capacitive circuit. In Figure 2, we have a typical phasor diagram with a 60° phase shift (PF = 0.5), showing the current leading the voltage, and the current lagging the voltage.
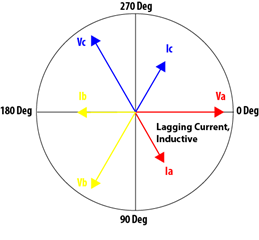
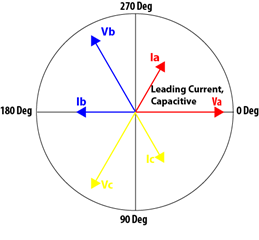
Fig. 2b: 60° Leading Current
When viewing a vector diagram, understanding reference point and direction is imperative to understanding what power measurement the vectors represent. Knowing this, it is easy at a glance, to determine the required quantity each phasor represents. In electrical systems, power can be expressed in three different quantities, sometimes with different names. Below are the three forms of power, plus different ways they are identified.
- Watts: Actual amount of power dissipated in a circuit. Also called:
- Real Power
- True Power
- P
- Can be positive or negative
- Volt-Amps: Product of a circuit’s voltage and current, without reference to phase angle. Also called:
- Apparent Power
- S
- Always an unsigned value, neither positive or negative
- Volt-Amps Reactive: Power absorbed and returned in loads due to reactive power. Also called:
- Vars
- Reactive power
- Q
- Can be positive or negative.
As shown, it can be difficult to keep track of the different powers, yet using a Vector diagram can help simplify the process. By looking at the vector, one can determine a large amount of information about the load, and if the system looks correct. The relationship between the above values is defined by the Power Factor (PF) which is a ratio of the real power to the apparent power, and can be seen as values of -1 to 1. It can be calculated by the following formula:
[latex display=”true”]pf = \frac{Watts}{VA}[/latex]Where Pf = Power factor and = the phase angle difference between the voltage and current. Another means of calculating power factor is:
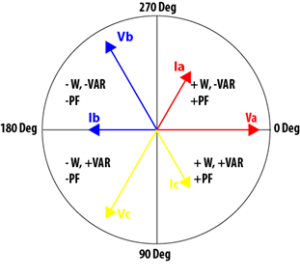
[latex display=”true”]pf =\cos\theta[/latex]Understanding this relationship can help understand various vector diagrams. One reason is the vector diagram can be broken up into 4 sections, sometimes called quadrants. The below chart is derived with reference to Figure 3.
| Watts | VARs | PF | |
| 0-90° | Positive | Positive | Positive |
| 90 – 180° | Negative | Positive | Negative |
| 180 – 270° | Negative | Negative | Negative |
| 270 – 360° | Positive | Negative | Positive |
Table 1: Sign Convention Based on Vector Diagram Angles
At 0° and 180°, the Power factor is 1 and -1, respectively, while at 90° and 270° it is 0. These are the angles at which the signs will change values. Please note, the signs are based off reference between Va and Ia respectively. As in, if Va is at 0, and Ia is at 200°, then the watts, vars and power factor will all be negative.
Based on the sign, and the location of the vector, it can be determined if the power is received or delivered. Delivered power is power that is consumed by the load, or billable power. Received power is power that is being generated and flowing back to the grid, or upstream of the metering point. In many instances, this is found in locations where solar panels or generators are used in peak shaving or load sharing scenarios. For example, when the sun is out and the load is low, the solar panel will send extra power back into the grid, sometimes for bill credits. When the sun is down or the load is higher than the solar panel can supply, power flows towards the load and is billable. With the emergence of solar panels and distributed generation, it is of upmost priority that any meter in a situation where power is bi-directional (able to flow in either direction) that the meter be tested with power flowing in both direction.
Table 2 shows what to expect, based on the phase angles of a vector diagram.
| Watts | VARs | |
| 0-90° | Delivered | Delivered |
| 90 – 180° | Received | Delivered |
| 180 – 270° | Received | Received |
| 270 – 360° | Delivered | Received |
Table 2: Received and Delivered Power
When performing test, a quick glance at the vector diagram, along with the above knowledge, can help diagnose a meter installation in a short period of time.
LEARN MORE
If you felt like you needed to go back to high school to figure some of this stuff out, here’s a few links to help you get back in the saddle:
The Physics Classroom: Vector Diagrams
YouTube
Please Post Questions & Comments Below or contact us here.


The 90, 180 and 270 degree representation looks different from other representative methods. Can you please clarify which system or International standard is this system of representation.
Hey Sankara! The phase positioning is commonly used in electric metering systems, but the two common methodologies are “IEEE” and “IEC”. Unfortunately, there is no defined standard. More details can be found here: https://www.se.com/se/en/faqs/FA212521/
In this 90, 180 and 270-degree representation Yellow phase will reach peak value 1st.
Then phase rotation will be 2-3-1-2-3-1
Can explain?